Tuesday, 20 December 2011

A Geologists View of Climate Change


Global warming is real. Comparison of the two pictures (below) of the Rhone glacier in 1895 and 2010 shows just how much ice is melting and how fast. The ice that used to cover the slope of the mountain falling down towards the village of Furka simply isn't there any more, The ice is retreating by 7m per year.


Some global warming is natural - from a geologists point of view we are interested in the difference between the normal level and the current level. This difference is called the Enhanced Greenhouse Effect (EGE).


What the Syllabus Says - and the Details


A major cause of the EGE is carbon dioxide in the atmosphere (there are other causes; mostly methane). The major sources of carbon dioxide in the atmosphere are volcanic emissions and the burning of fossil fuels.
Currently, humans are attempting to reduce carbon dioxide emissions by the use of energy efficiency, renewable energy resources; hydroelectric, wind, geothermal (including heat engines) and by use of nuclear energy - which is non-renewable.
It is possible that, in the future, some of the carbon dioxide produced by power stations may be sequestered (stored by being pumped underground) in old oil/gas fields.


The enhanced “greenhouse effect” is a major contributor to global temperature increases. We can track this temperature rise with data for the past 140 years.


You need to be able to interpret data showing evidence for the increased rate of “greenhouse gas” emissions - such as working out the increase in average global temperature between 1860 and 2010 from the graph above.


There is evidence of increasing carbon dioxide, a major greenhouse gas, in the atmosphere from direct measurement and ice cores. We use ice the carbon dioxide content of the air trapped in ice at the poles to get data for the period before we actually started taking measurements. 

There are both positive and negative natural effects of the carbon dioxide content in the atmosphere. Positive effects speed up global warming, negative ones slow it down.

The melting of the ice-caps causes a reduction of icecap albedo (the ability of the ice to reflect heat and light from the Sun). As less heat is being reflected, more stays on the Earth. This causes the Earth's temperature to rise further - it gives accelerating warming.
On the other hand, carbon dioxide gets dissolved in sea water where it is used by plants for photosynthesis an by shellfish to produce their shells. When these shellfish die their shells can go on to form limestone. This locks away the carbon dioxide so it can't add to global warming. This is a negative effect on global warming - but not a big enough one, as can be seen from the graph of carbon dioxide in the atmosphere above.


Global warming affects continental ice sheet dimensions. As the atmosphere warms up, the ice melts so the ice sheets shrink. The maps below show how the Arctic is failing to keep more and more of its 'older ice' through the summers.


As the Earth warms, some elements of weather become more extreme and unpredictable. We see this happening in the forms of; windier weather (including more hurricanes), wetter weather due to more evaporation from the oceans and also by the shifting of weather patterns due to alterations of the temperature patterns in the atmosphere.


Global warming also affects global sea level. As yet, sea level changes don't seem that large, except it takes a vast amount of melted ice to raise the sea level across the whole world by the 20cm rise shown in the graph below.

There is good evidence of global sea level change during Pleistocene glaciations on a much larger scale than the current levels. There have been rises in sea level as shown by submerged forests and drowned valleys and falls in sea level as shown by raised beaches.

Raised beaches - beach areas which are no longer at sea level and have grown grass etc on top of them - as shown in this picture of Langerstone Point.

Submerged forests - forests that have been flooded by the sea due to rises in sea levels since they started growing. The one below is at Borth in Wales.

Drowned valleys form where an increase in sea level floods the bottom of a valley near the sea. The map below shows how the sea has 'invaded' a number of valleys in eastern China.

You need to be able to use maps, photographs, and diagrams to identify the characteristics of these three features. Be careful with your explanations though - isostasy is responsible for most raised beach and submerged forest features in Britain. 

Britain on the Move 2: The Mesozoic and Cenozoic Eras


The Mesozoic era started 225 million years ago. A massive extinction event brought the permian period to an end and started the Triassic. This didn't actually change Britain very much as our area was still firmly in desert lands - see the blog on Britain in the Palaeozoic for a description of what this was like. The map below shows how the major land areas of the world were arranged at that time. Britain was about 18 degrees north of the equator.


What the Syllabus Says - and the Details


For Britain, the most interesting periods of the Mesozoic were the Jurassic and Cretaceous. During these periods Britain was 30o - 40o north of the equator and covered with  shallow seas similar to those found in the less polluted parts of the Mediterranean today. Inevitably, this 
type of environment caused the development of large areas of limestone during the Jurassic, such as this outcrop on the North Somerset coast.

In the Cretaceous a special type of very pure limestone called chalk was deposited as the water had very little sediment brought into it from land areas.

The Mesozoic was when Africa separated from America to give rise to what we now call the Atlantic Ocean. This happened over an extended period from 200 to 180 million years ago. Such crustal splitting always happens with major extrusive igneous activity (see plate tectonics blog) - we some see evidence for this in the form of Jurassic basalt developments; the best ones happen to be under the North Sea!


During the Cenozoic era the Atlantic has continued to open. In the early Tertiary period this gave rise to the development of thick flood basalts along the west coast of Scotland and Ireland such as these a Drumadoon Point. The thickness of these deposits means that they

cooled slowly enough to produce columnar jointing - best seen at 'The Giant's Causeway' in Ireland.


Also during the Cenozoic era Britain has moved from 50 degrees to 60 degrees North of the equator. This has meant that during the glaciations of the Quaternary Period Britain has been far enough north to be covered with ice, the map below shows how far the ice got in the last glaciation.

The ice scoured the landscape, removing large amounts of material (see sedimentary rocks blog). When the ice melted the material was left behind as glacial till, a mixture of very large, medium and fine material containing a lot of clay - as shown in the picture below.


For a detailed wander through how Britain got to be as it now is click this link  How Britain Formed to get to a really well presented and informative site.

Britain on the Move 1: The Palaeozoic Era


The area of the Earth that we now call Britain has moved around a lot over time. The evidence for this is contained in our rocks - Britain has just about the most complicated geology of any area of its size anywhere in the world!


What the Syllabus Says - and the Details


The rocks of the Britain area provide evidence of changing latitude and climate as Britain moved northwards.

In the Lower Palaeozoic Britain was south of the equator and was involved in a major plate collision which produced the Caledonian mountain belt. We still have the 'stubs' of the mountains formed by his collision in Scotland and North Wales. 

The evidence for these statements comes from...
Turbidites - these deep water sediments which are found in the west of Britain, for instance in north west Wales, show that the are we now call was Britain was then under deep water.
 Granites - The granites intruded into the west of Britain during the lower Palaeozoic show that a major plate collision was occurring - these granites are typical of a collision between two continental plates. The collision was between what we now call Europe and whet we now call North America.
Significant regional metamorphism is also found throughout the west of Britain. This would also indicate a plate collision. The region also contains thrusts and folds which would have been caused by that plate collision.
We know where the boundary between the two plates occurred as the fossils to the north and south of the line show very different lines of evolution.


In the Upper Palaeozoic - Britain drifted across the equator.
We can track the periods of geological time in Britain from the conditions seen in the rocks from each one.
At the start of the Upper Palaeozoic, the Devonian period, Britain was about 15 degrees south of the equator and was covered with desert. Sandstone rocks were produced. The conditions would have been similar to this picture from the Australian desert, which is 15 degrees south of the equator today.

The next period of the Upper Palaeozoic, the Carboniferous, had two distinct periods of 'geography' for Britain. 
In the Lower Carboniferous Britain was an area of tropical seas resulting in the formation of vast amounts of Limestone - the photo below shows a modern version of these seas.

By the Upper Carboniferous, Britain was on the equator and was covered with swamp forests growing in deltas similar to the swamps in modern day Florida, except that the trees in the Carboniferous would have been tall tree ferns.

These tree ferns are the source of the coal from that we have in Britain. When they died they fell into the water, didn't rot because of a lack of oxygen in the water, and steadily formed a deep pile. The pressure from this pile crushed the tree ferns at the bottom so much that they lithified to produce the coal. Below is an example of coal with fossilised tree fern fronds.
The last period of the Upper Palaeozoic was the Permian. During this period Britain had moved to 15 degrees north of the equator, a position occupied by the current Sahara desert


This gave rise to desert conditions causing the development of wind-formed dune-bedded sandstone such as the rock shown below from Bridgnorth in Shropshire. Notice the steeply angled cross bedding pattern which indicates deposition by wind - typical of a desert sandstone.

The rapid and extreme changes in temperature in the desert conditions caused expansion of the rocks as they heated up in the day followed by contraction as they cooled down at night. This continuous expansion and contraction caused angular pieces to break off - these accumulated to form breccia deposits like the ones below exposed at Torquay in Devon.


The area we now now as the North Sea was a very shallow sea during the Permian. We call this sea the Zechstein Sea. The high temperatures caused evaporation of the water on a regular basis leading to the development of evaporites, hence there are many layers of salt rock under the North Sea today. For more details click here .

The Torquay area has excellent exposures of rock which illustrate the development of Britain through the Upper Palaeozoic era. For more information click here .

Predicting Earthquakes


Geological Hazards


The Universe is not a friendly place - it is out to get us! The Earth itself is not much friendlier - we are constantly at risk from volcanoes, earthquakes, tsunamis, landslides...


What the Syllabus - and the Details


There is a range of geological events that can be hazardous - click the links to see videos of them in action!
earthquakes which are caused when layers of rock break under stress to produce a fault cause shaking and can trigger landslides - for example this one in Sichuan China.
volcanic eruptions produce flows of lava, ash, pyroclastic flows and mud flows.
landslides [and related subsidence] 
and tsunamis . This video shows how tsunamis are formed.

The level of risk of a hazard is associated with life and property and relates to
population density - the more people there are in the area the more likely it is that lots of people will be affected.
technology - if the local buildings are constructed to stand up to an earthquake then damage will be less, if an area has lots of road and rail  links then there is more chance that some of them will still be useable to bring in help after the event.
development...
economic situation - richer areas are more likely to be able to provide help after the event, education - people are more likely to react well if they know what is happening and have been trained in what to do.
communication - if there are more links then there is more chance to ask for and receive help.

The level of accurate hazard prediction is limited - we can say where earthquakes, volcanic events etc are most likely to occur but we don't have the ability to say when.
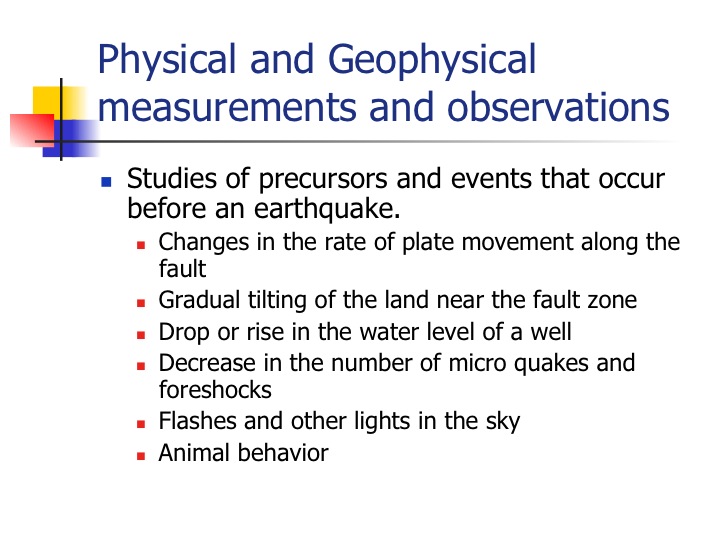
The methods of reducing risk include appropriate building design and regulation, prediction, warning schemes, evacuation. You need to be able to describe the following methods used in hazard prediction: hazard interval patterns (seismic gaps), ground deformation (tiltmeters), groundwater changes, gas emissions, early warning systems. These are covered in the blog on Predicting Earthquakes.


Plate Tectonics


The links below will take you to really useful places!
So much has been posted on the web by others! Plate tectonics is a popular subject. You do need to be a bit wary of some sites - they may not be totally factually correct. Below is a list of links to some really useful sites that cover what you need to know about plate tectonics.


Plate Tectonics - An Introduction - a brilliant overview of all the necessary material
Evidence for Plate Tectonics - the best site I've found on the evidence
Plate Tectonics Notes and Pics - this has some really good pictures of the different types of plate margins (but the text is a bit 'high level' for GCSE purposes).
The material on these sites is so good that I'm not going to add to them. Click away!


Here is what the syllabus says you need to know...


The jigsaw pattern fit of the continents and fossil distributions across the continents caused Wegner to come up with the theory of continental drift in 1915.
The detection of magnetic stripes either side of mid-ocean ridges leading to the age of the ocean floor being shown to get older as you go further from the mid-ocean ridges made Hess (1960), Vine and Matthews (1963) realise that the ocean areas must be continuously be being added to.
J. Tuzo Wilson (1965) found the process that stopped the Earth needing to get bigger as the ocean areas grew - what we now call 'Plate Tectonics'
and direct laser measurements tracking the movement of the plates using satellites has been used to confirm that the movements do take place.
There is a range of evidence supporting the theory of plate tectonics and the direction and rate of plate movement such as mountain ranges, subduction zones, rocks showing that continents must have moved through different climatic zones...

We no know that the lithosphere  is a cold, rigid outer shell that is composed of the crust and the uppermost part of the mantle. It is underlain by the asthenosphere, a weaker layer. The lithosphere is divided into a number of rigid plates which move relative to one another due to thermal convection in the mantle.
The relative movements between plates produce different effects at different types of plate boundary.
Divergent (constructive) plate margins: [basalt extrusion, sea floor spreading, the
origin of basaltic magma by partial melting of the upper mantle, ocean ridges, high
heat flow, rift valleys, abyssal plain]
Conservative plate margins: [earthquake activity, transform faults] (San Andreas
fault zone)
Convergent (destructive) plate margins :
1. oceanic-oceanic: [island arc/trench systems] (Java-Sumatra/Caribbean) 2. oceanic-continental: [active continental margins; subduction zones Benioff
zone, partial melting producing andesitic and granitic magmas] (the Andes) 3. continental – continental: [mountain building, folding, thrust faulting, partial melting of the crust producing granites, associated regional metamorphism]
You need to be able to Use maps to interpret the global distributions of earthquakes, igneous rocks and mountain belts in the context of processes at or near to plate boundaries.
Interpret the relative movement of plates from their plate boundary context shown in maps/diagrams.
Interpret the type of magmatism and seismic activity associated with different plate boundaries from data provided in text, diagrams, photographs or maps.


Landscapes Produced by Humans Exploiting the Geology


The reason that Geology originally became a popular and useful science was because it can be used to tell us where there are things in the ground, like coal, oil and metallic minerals that we can make money from. Our extraction (removal from the ground) of these resources has left its effect on the landscape. Some of these effects we can 'put right', some we can't. Some places need to be protected and are given SSSI or RIGS status.


What the Syllabus Says - and the Details


The landscape has been modified by...
Quarries 

                                           and gravel pits excavated for raw materials such as; building stones, aggregate, cement and road-stone. These material are mainly wanted for the construction industry.

Past mining activity has left; pits and shafts

spoil heaps 

and contaminated land (land that is 'poisoned' by waste materials and residues of mining activity).

All of these are now causing us problems.
Pits - people can fall into them.
Shafts - can collapse causing local 'earthquakes' and serious damage to buildings on the surface above them. The photo below shows the Crooked House pub which sits on top of the mines under the Dudley area of the West Midlands.


Spoil heaps can slide if they get wet - this can lead to damage and deaths. They can't be built on as they are too weak to take the weight.
Contaminated land obviously causes health issues for people, other animals and plants.

Cuttings (this one happens to show a rather brilliant syncline)

and tunnels have been excavated for roads and railways. These are unnaturally steep sided and are subject to landslides.

Much evidence of past mining/quarrying activity can be removed by landscaping. Country parks such as the one below in Wakefield (Yorkshire) have been developed on ‘brownfield’ mining/quarrying sites to give people 'nice places to visit' within easy reach of towns.

Sometimes geologists would prefer that sites are not filled in or covered over because old quarries and cuttings can have scientific importance, for example they may show a rare fossil or an important feature such as an unconformity. These places are protected as Sites of Special Scientific Interest (SSSIs). SSSI status is also given to sites where geologists have worked out something important in the past. Other sites may be useful for education or may have aesthetic importance. These are protected as Regionally Important Geological or Geomorphological Sites (RIGS).  Both SSSIs and RIGS can also be potential safety hazards unless well managed - see comments on pits, shafts etc above.

Local planning and environmental issues are often raised by the extraction of limestone, aggregate (gravel type material) and brick clay in environmentally sensitive areas
You need to be able to analyse these issues. Make comments about; spoiling the landscape , potential hazards, affecting places that are important for leisure or wildlife...

The disposal of domestic and hazardous waste can cause problems with groundwater contamination (which means the water gets poisoned due to waste material dissolving into it) and methane gas production. The methane is produced from the rotting of organic material. It can lead to fires and explosions!
You need to be able to analyse the geological and environmental issues involved in the disposal of domestic and hazardous waste.